
Knowing the interaction of loudspeakers with the room itself is of great interest when it comes to listener locations in home theaters.

The following figure 1. (b) shows such an interaction in frequency responses measured at four different listener locations for a loudspeaker in position C. The following figure 1. (b) shows such an interaction in frequency responses measured at four different listener locations for a loudspeaker in position C.

In figure 2. (c) each frequency response is an average over all six listener locations and just dependent on the three different loudspeaker positions (A, B, C). The domination of the loudspeaker position on the frequency response can be shown below 300 Hz. Higher frequencies are not that much affected and hence follow a similar pattern. The first order length mode at 26 Hz is not affected by these position changes.
Figure 2. (d) shows that the incidental sound is also influenced by listening locations. In (d) measurements made at listeners placed at seats 1, 3, 4 and 6 are averaged over loudspeaker locations 3 through 6. Again, similar effects on the frequency response can be seen. The high frequency range mostly follows a similar pattern, where the low frequencies are determined by each seat location. Important conclusions can be drawn from this graph which should be considered for planning a home theaters.
The region around 50 Hz shows different sound pressure levels dependent on the listening spot. Listener locations close to the pressure peak (front row seats) of the second-order room mode (speed of sound, 343 m/s divided by the room length of 6.7 m) will receive a powerful bass, whereas listeners located close to the null (back row seats) are experiencing a less powerful or more even bass.
The dip at 80 Hz can be explained by the loudspeaker placement close to 1/4 length of the room and therefore causing destructive interference with the adjacent front room boundary. This results in failing to excite the third-order mode.
Moreover, a difference in the frequency spectrum regarding the low and upper frequencies can be observed. A transition zone between the discrete room modes in the low frequency range and the irregular spaced higher frequencies can be given by a cross-over frequency fc, also called Schroeder frequency:
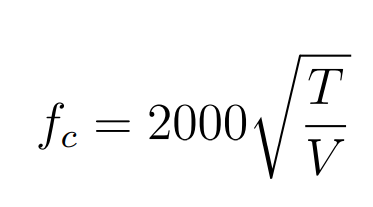
where T is the reverberation time in seconds, and V is the volume of the room in cubic meters.
The figure 3. shows the transition zone of the cross-over frequency in dependence on the room size and the application of the descriptive Wave Acoustics (reflections are considered as waves) and Ray Acoustics (reflections are considered as rays) dependent on the Schroeder frequency.
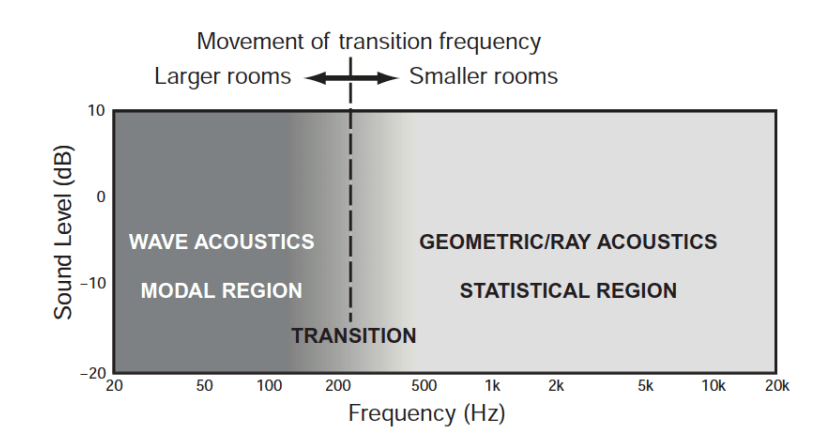
Since the Schroeder frequency is based on empirical observations, it can be a useful parameter to make predictions but for more precision it requires detailed acoustical measurements and visual analysis of the obtained data.
What has been said so far and what we will discuss in the future, will pave the way for creating a home theater of the highest quality. The audio products offered in Saba Smart systems, which include Dali speakers, Yamaha amplifiers and inakustik cables with their great variety and high quality, make it possible to implement any type of equipment according to the relevant needs.

